One platform.
Every answer.
Know what your fleet will earn before the market settles it. BESSi predicts PJM regulation revenue hours ahead, validates every Performance Score independently, and explains each number it produces — from a permanent historian you own, on a read-only platform that never touches your controls.
Predicted vs. settled regulation revenue
Why this prediction Explainability · G-12
- RMCCP forecast+0.41
- Fleet SoC headroom+0.27
- U12 derate (thermal)−0.18
- Comms latency, Site 2−0.09
Illustrative data.
Five answers every battery fleet needs.
BESSi grew up on a working PJM frequency-regulation fleet — four sites, 89 containers — where it found trip precursors and revenue answers the vendor stack could not.
Predictmarket revenue
Regulation revenue forecasts at 1-, 4-, and 24-hour horizons, plus the hours most likely to spike — anchored to the clearing prices and PJM Manual 12 methodology the market uses to pay you.
Validateperformance
An independent 100-hour Performance Score, reconciled against your provider's number, with commanded-versus-delivered divergence found and explained when it slips.
Monitorasset health
Fleet, site, container and string views; thermal outliers against the fleet band; decoded alarms with the trip replayed to the second and causes ranked.
Explainevery number
No black-box KPIs. Every prediction ships with contributing variables, a confidence score and plain-language reasoning — and you can ask any chart why.
Analyzehistorical data
A permanent historian in your own cloud tenant, beyond OEM retention windows — so degradation, capacity tests and disputes are answerable from data you own.
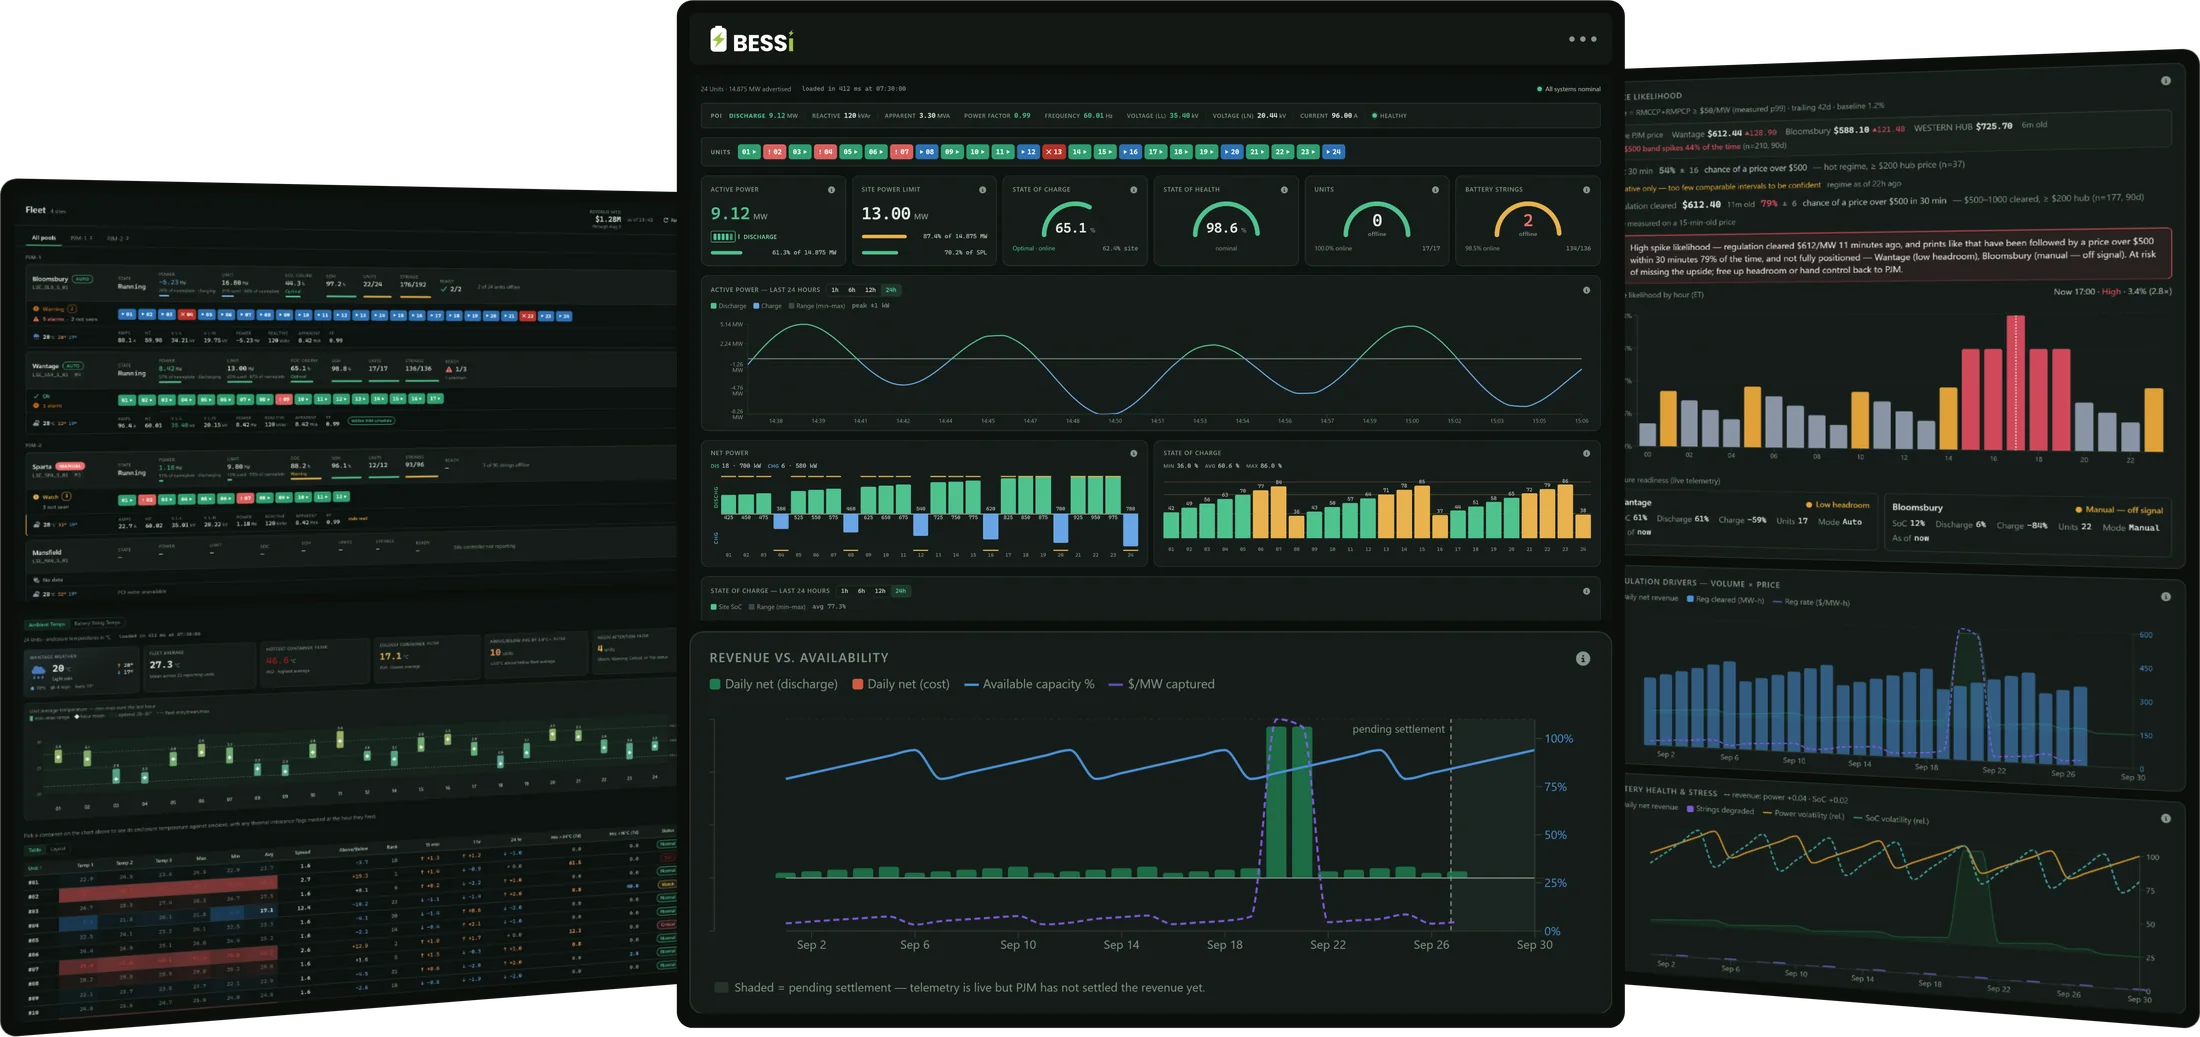
Fleet, site and market views — one read-only platform, from the whole fleet down to a single string.
Watch the 55-second overviewTake the product tour.
The same BESSi films running on the monitors at RE+ booth C4782 — from fleet view down to a single string. Pick a chapter to jump straight to it.
- Tour chapters
-
- Each site's state, power, limit and charge
- Every container as a live chip
- Grid meter readings against the PJM schedule
-
- Live gauges for power, charge and health
- 24 hours of site power, charging and discharging
-
- Amps, volts, power and power factor, by phase
- Per-phase balance at the meter
- Power quality and a lifetime energy ledger
-
- Every container at a glance
- Strings, inverters and limits per container
- State of charge, string by string
-
- Ambient and battery-string temperatures, against the fleet
- Every container against the fleet band
- Thermal balance names the worst strings
-
- One banner: the single most urgent action
- Go out, trim or shed, priced per site
- Every signal on one 24-hour timeline
- Which way the grid is pushing, and what it pays
- The next 24 hours, spike by spike
-
- Every alarm, decoded and named
- Replay the trip, onset to the second
- Causes ranked, with every past match
-
- Commanded versus delivered, every divergence explained
- The hours most likely to spike
- Ask AI explains the chart in plain language
No black-box KPIs.
Every prediction and recommendation BESSi produces ships with four things. It is a governance rule in the platform, not a feature toggle.
Contributing variables
Which signals moved the number — clearing prices, SoC headroom, thermal derates, communications health.
Confidence score
How sure the model is, and the band around the estimate, so a 92% call is treated differently from a 60% one.
Explainability logic
Per-feature attribution for each forecast, readable by an operator, not just a data scientist.
Operational reasoning
What to do about it, in plain language, with the physics and market context that justify the recommendation.
Plain-language answers, grounded in your data — the AI explains what a chart shows and what drove it.
Revenue you can see coming, not just settle after the fact.
The settlement loop between an operator, its market-services provider, and PJM runs over hours or days. By then a degradation event has already cost you. BESSi closes that gap with forward-looking regulation revenue prediction, anchored to the same clearing prices and Performance Score methodology PJM uses to pay you.
- Regulation revenue prediction — machine-learning forecasts at 1-hour, 4-hour, and 24-hour horizons, trained on your fleet's telemetry, RegA/RegD signals, and 5-minute RMCCP / RMPCP clearing prices.
- Independent Performance Score — a 100-hour rolling score computed from the PJM Manual 12 methodology, reconciled against the provider's number to within ±0.5%, with root-cause attribution when it slips.
- MW loss to dollars — every derate, comms delay, or SoC excursion converted to revenue at risk (RMCCP × performance), per unit and per fleet.
- Market context, not false alarms — RegA charge bias and market artifacts are tagged so they are never mistaken for hardware degradation.
- What-if replay — rerun a past event through the physics twin to see what a different SoC target or bid would have earned.
- Spike likelihood — the next 24 hours, spike by spike: the hours most likely to see a price spike, so the desk can position ahead of them.
- Commanded versus delivered — every divergence between the regulation signal and what the fleet delivered, found and explained.
Performance score · 100-hour rolling
Illustrative data.
BESSi is ready for PJM's move to separate Regulation Up and Regulation Down products.
One intelligence layer above every vendor in your stack.
BESSi sits over whatever EMS, BMS, and PCS your fleet already runs. It reconciles operational truth with market truth and compliance truth — one number per unit and per fleet.
Owner-controlled historian
A permanent record in your own Microsoft Fabric EventHouse, decoupled from OEM retention windows. Multi-year degradation, capacity demonstrations, and settlement disputes are answerable from data you own.
Fleet, site, and unit dashboards
Single pane of glass: unit status at ≤1 s, strings at 5 s, fleet benchmarking with peer z-scores, an executive compliance view, and a 0–100 compliance score per unit.
Alarms that find root cause
Two-tier alarming with dedup and digest, 24 hours of BMS / PCS / HVAC / gas / RTU context attached to every critical alarm, safety heartbeat, and PJM emergency procedure alerts.
Asset health and degradation
Five round-trip-efficiency variants isolate battery aging from market artifacts. Weak-rack scoring, per-string divergence, PCS thermal derating, and an inverter health score with 30 / 90 / 180-day failure probability.
Forensic root cause engine
Every significant fault auto-opens a durable case with telemetry, decoded events, and an AI-written initial RCA. Event replay reduces time-to-diagnosis from days to minutes.
Audit-grade compliance evidence
Append-only, hashed, user-attributed evidence chains for PJM, FERC 755 / 841, NERC CIP posture, NFPA 855 safety monitoring, and OEM warranty claims — continuous, attestation-grade, no spreadsheet scramble.
Safe beside any OEM stack. Owned entirely by you.
Control-system safety integrity is structurally guaranteed: no BESSi component writes back to a battery management system, inverter, HVAC, gas detection, RTU, or market portal. The collector reads, the historian keeps, the engines analyze — and every byte lands in a cloud tenant you control.
- Vendor-agnostic — proven on a major integrator's containerized BESS stack; designed for Modbus TCP, BACnet, and REST interfaces across the industry.
- Five shared engines — telemetry and historian, KPI computation, asset health, market analytics, and simulation / replay feed every dashboard from one data model.
- Right to operate without us — you own your deliverable instance and your data; live source sync acts as escrow.
- Physics-anchored twin — open-source battery electrochemistry and balance-of-plant models calibrated to your cell maker's own lifetime curves.
Built for the people accountable for a battery fleet.
Owner / operators
One compliance, MW, revenue-loss, and risk number per unit and per fleet, with the evidence behind it.
Operations teams
Relief from a hundred-plus alarms a day, with root-cause tooling and a durable case for every fault.
Commercial and finance
Independent validation of Performance Score and regulation revenue against the market-services provider.
Lenders, insurers, OEMs
A reproducible state-of-health evidence chain for warranty claims, capacity demonstrations, and due diligence.
Built on a live PJM regulation fleet, not a lab.
BESSi was engineered on its owner's live fleet — four sites and 89 containers of PJM frequency regulation. Three findings from that fleet show what per-string and cross-source analytics see that aggregated vendor telemetry hides.
A 16-minute warning the stack missed
An AC over-current bit flapped for 16 minutes before an inverter trip. Cross-checking the PCS fault against the point-of-interconnection meter contradicted the inverter's own over-voltage claim, pointing to a single sensor defect rather than a grid event.
Reframing a fault family vendors could not explain
Recurring trips across two sites were traced to individual strings collapsing one sample before the fault under high-SoC, over-nameplate charging. The aggregator raised no alarm; per-string divergence did.
One module, found an hour early
A string isolation was root-caused to a single rack-module communication fault. The precursor — a cell-voltage spread stepping from 0.05 V to 0.2 V — was visible more than an hour before the contactor opened.
 V20 EnergyDeveloped by
Owned by a fleet operator. Engineered by its integrators.
V20 Energy, a PJM frequency-regulation fleet owner, owns BESSi and proved it on its own fleet. Medullus Systems' energy practice develops and operates the platform. Medullus integrates industrial controls, builds Azure and Microsoft Fabric data platforms, performs incident forensics on grid-scale batteries, and runs a 24×7 monitoring desk — so the platform is shaped by field work, not slideware.
- Industrial-controls integration: Modbus TCP / BACnet, PLCs, inverters, BMS, gas detection, UPS
- PJM market-data integration and regulatory-grade compliance evidence
- Overnight BESS market monitoring and maintenance desk, executing your playbook
- Managed application support, M365 migration, and managed site PCs
String current · 8 strings · last 60 s
Illustrative data.
See your fleet the way BESSi sees it.
A 30-minute walkthrough with your own sites on the table: revenue outlook, Performance Score reconciliation, and a string-level health view. Live dashboards, not slideware.
RE+ 2026Visit booth C4782 at the Las Vegas Convention Center, November 16–19 — or book time with the team.
Prefer email? connect@medullus.com · (732) 800-6030
Thank you — we'll be in touch.
Your details are with the BESSi team. Expect a note within two business days to find a time to walk through your fleet.